Best Air Quality Apps for Wildfire Season (2026)
The best air quality apps for wildfire smoke monitoring. Compare AirNow, PurpleAir, IQAir, and built-in weather AQI to build your smoke alert setup.

Table of Contents
- AirNow: The EPA's Official App
- PurpleAir Map: Real-Time Community Sensors
- IQAir AirVisual: Global Coverage With Forecasts
- Apple Weather and Google Weather AQI
- State-Specific Tools and Fire Maps
- fire.airnow.gov (Fire and Smoke Map)
- State Air Quality Agencies
- When Apps Are Not Enough: Indoor Air Quality Monitors
- What to Look For in an Indoor Monitor
- Pairing Indoor and Outdoor Monitoring
- How to Set Up AQI Alerts
- AirNow EnviroFlash
- IQAir AirVisual
- Apple Weather
- Google Weather
- Combining Alerts With Action Plans
- The Bottom Line
TL;DR
For wildfire season, Clean Air Critic recommends pairing two free tools: AirNow for official EPA forecasts and PurpleAir Map for real-time hyperlocal readings. Together they cover the gaps each has alone. Add an indoor air quality monitor like the Airthings View Plus once outdoor AQI stays above 100, because your indoor air may not be as clean as you think.
Full Comparison
| # | Product | Best For | Rating | Price | |
|---|---|---|---|---|---|
| 1 | Airthings View Plus Top Pick Airthings | Best All-in-One Indoor Monitor | 4.6 | $$$ | Check Price |
| 2 | PurpleAir PA-I-Indoor PurpleAir | Best Research-Grade PM2.5 Monitor | 4.3 | $$ | Check Price |
Clean Air Critic earns commissions from qualifying purchases. This does not influence our recommendations.
When wildfire smoke hits, checking air quality becomes a daily routine. These apps and tools tell you when to seal up, when to run your purifier on high, and when it is safe to go outside.
The challenge is that no single app does everything well. The EPA's official data is authoritative but sparse and slow. Community sensor networks are fast and dense but can overestimate smoke readings. Your phone's built-in AQI is convenient but lacks detail. The best approach during wildfire season is layering two or three of these tools so their strengths cover each other's blind spots.
Here is how each one works, who it is best for, and how to combine them into a monitoring setup you can rely on when the sky turns orange.
AirNow: The EPA's Official App
Best for: Authoritative AQI readings, next-day forecasts, and smoke advisories.
AirNow (airnow.gov) is the EPA's free air quality platform, available as a website and mobile app for iOS and Android. It pulls data from the federal regulatory monitoring network, which uses instruments that cost $15,000-$100,000 each and meet strict calibration standards. When an official AQI number appears in a news report, it almost always comes from AirNow.
What it does well:
- Provides validated, calibrated AQI readings you can trust without adjustment
- Offers next-day AQI forecasts for your area
- Includes health guidance at each AQI level (who should stay indoors, what activities to avoid)
- Covers the entire US with a consistent measurement standard
- Sends email alerts via the EnviroFlash notification service
Where it falls short:
- Sensor coverage is thin outside metro areas. Many western counties have one EPA monitor or none. If the nearest sensor is 25 miles away, your local conditions could be significantly different.
- Data updates hourly, not in real time. During fast-moving smoke events, an hour-old reading can be dangerously outdated. The wind shifts, and AQI at your location can jump 100 points in 30 minutes.
- The app interface is functional but dated. It works, but PurpleAir and IQAir offer smoother map experiences.
Verdict: AirNow is your baseline. Every other reading you see should be compared against it. Use it for forecasts, official advisories, and calibrated data. Supplement it with PurpleAir for real-time, hyperlocal readings.
PurpleAir Map: Real-Time Community Sensors
Best for: Hyperlocal, real-time PM2.5 readings during active smoke events.
PurpleAir (map.purpleair.com) is a free web-based map showing data from thousands of community-owned air quality sensors. Each sensor costs $200-$300 and reports PM2.5 readings every 2 minutes. In many neighborhoods, PurpleAir sensors are spaced every few blocks, giving you readings that actually reflect the air outside your home rather than a monitoring station miles away.
What it does well:
- Updates every 2 minutes, so you see smoke arriving in real time
- Sensor density in suburban and fire-prone areas often exceeds AirNow by 10-50x
- Shows PM2.5 concentrations as a color-coded map, making smoke plumes visually obvious
- Includes an EPA correction factor toggle that adjusts raw readings for wildfire smoke conditions
- Completely free to use (no account required)
Where it falls short:
- Raw readings overestimate PM2.5 during wildfire smoke by 30-80%. The laser-based sensors miscount when smoke particles are different sizes than typical urban pollution. Always use the EPA correction factor layer on the map.
- Sensor coverage depends on where individuals have installed them. Some rural areas have zero sensors.
- No mobile app. The website works on mobile browsers but is not optimized for small screens.
- No forecasts. PurpleAir shows current and recent data only.
How to use the EPA correction factor: On the PurpleAir map, click the data layer dropdown and select "US EPA PM2.5 AQI." This applies a correction algorithm developed by the EPA specifically for wildfire smoke conditions. Without this correction, a PurpleAir sensor reading AQI 250 might actually correspond to an AQI of 150-180 on a calibrated instrument.
Verdict: PurpleAir is the single most useful tool during active wildfire smoke events. Its real-time updates and dense sensor coverage fill the exact gaps AirNow leaves. Just remember to apply the EPA correction factor.
IQAir AirVisual: Global Coverage With Forecasts
Best for: International travelers, 5-day forecasts, and health recommendations.
IQAir AirVisual is a free app (iOS and Android) that aggregates government monitoring data, its own sensor network, and satellite-based estimates to provide air quality readings for locations worldwide. It covers over 100 countries, making it the go-to for anyone tracking air quality outside the US.
What it does well:
- 5-day AQI forecasts help you plan ahead during wildfire season
- Push notifications with customizable AQI thresholds
- Health recommendations based on your personal sensitivity settings
- Combines government data with IQAir's own monitoring stations
- Clean, polished app interface with historical charts
Where it falls short:
- In the US, its data often lags behind both AirNow and PurpleAir during fast-changing smoke events
- Forecast accuracy drops significantly beyond 24-48 hours during active wildfire events
- Some features require a paid subscription
- Sensor density in rural areas is lower than PurpleAir's community network
Verdict: IQAir AirVisual is the best option if you travel internationally or want push notifications with multi-day forecasts. For hyperlocal US wildfire monitoring, PurpleAir and AirNow remain the stronger pair.
Apple Weather and Google Weather AQI
Best for: Quick at-a-glance AQI checks without opening a separate app.
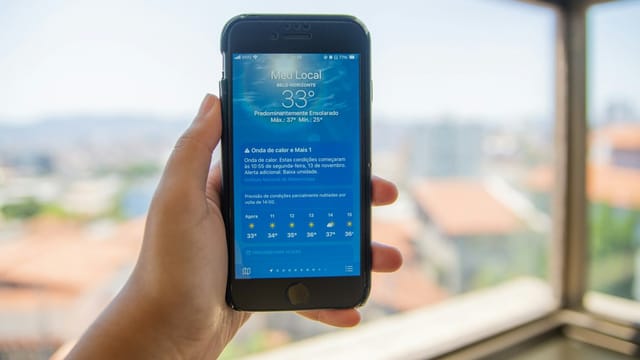
Both iOS (Apple Weather) and Android (Google Weather) now display AQI data directly in their built-in weather apps. You see air quality alongside temperature and precipitation without installing anything.
What they do well:
- Zero friction. AQI is right there on your weather screen.
- Include air quality alerts when AQI reaches unhealthy levels
- Pull data from established providers (BreezoMeter, The Weather Channel)
Where they fall short:
- Limited detail. You get a single AQI number and a color, but not the PM2.5 breakdown, forecast timeline, or sensor source information you need for informed decisions during smoke events.
- Updates can lag 1-3 hours behind actual conditions during fast-moving smoke events.
- No hyperlocal data. The reading applies to a broad area, not your specific neighborhood.
- No customizable alert thresholds.
Verdict: Use built-in weather AQI as your first alert. If it shows AQI above 50 during fire season, open PurpleAir or AirNow for the full picture. Built-in weather AQI is a smoke detector, not a monitoring system.
State-Specific Tools and Fire Maps
Best for: Tracking active fires and smoke plumes visually.
Beyond the main apps, two resources are worth bookmarking for wildfire season:
fire.airnow.gov (Fire and Smoke Map)
The EPA's Fire and Smoke Map overlays active fire locations, smoke plume estimates, and AQI data on a single map. It blends EPA monitors, PurpleAir community sensors (with the EPA correction applied), and satellite-based fire detection. This is the best single view for understanding how a wildfire is affecting air quality across a region.
The satellite smoke layer is especially useful in rural areas with no ground sensors. It cannot tell you exact PM2.5 readings, but it shows you whether smoke is overhead.
State Air Quality Agencies
California (CARB), Oregon (DEQ), Washington (Ecology), and Colorado (CDPHE) all run their own air quality monitoring networks and forecast tools. These state agencies sometimes have sensors in locations the federal network does not cover. Check your state's environmental agency website for additional data points during local fire events.
When Apps Are Not Enough: Indoor Air Quality Monitors
Outdoor air quality apps tell you what is happening outside your walls. But during wildfire season, the question that matters most is what you are breathing inside.
Smoke infiltrates homes through gaps around doors and windows, through HVAC systems, and through building envelope cracks. The rate varies enormously. A well-sealed home built after 2015 might keep indoor PM2.5 at 15 µg/m³ when outdoor AQI is 180. A drafty 1960s home could see indoor PM2.5 above 60 µg/m³ at the same outdoor conditions.
Without an indoor monitor, you are guessing. You might be running your purifier on high in a room that is already clean, or you might think your sealed bedroom is safe when PM2.5 is quietly climbing because of a gap you did not notice.
What to Look For in an Indoor Monitor
For wildfire season, PM2.5 is the measurement that matters. Look for a monitor that displays PM2.5 in micrograms per cubic meter (µg/m³) with updates at least every few minutes.
The Airthings View Plus tracks PM2.5, CO2, VOCs, humidity, temperature, and radon in one unit. Its app logs historical data so you can see how indoor air quality changed overnight or while you were away. At $299, it is the most complete single-device option. For a deeper look at your options, see our best indoor air quality monitors roundup.
The PurpleAir PA-I-Indoor is a research-grade PM2.5 sensor that uses the same dual-laser technology as PurpleAir's outdoor network. It reports to the PurpleAir map, so you can compare your indoor readings directly against nearby outdoor sensors. At $199, it is focused purely on particulate matter but does that job exceptionally well. Check our best PM2.5 monitors for wildfire smoke guide for detailed comparisons.
Pairing Indoor and Outdoor Monitoring
The most useful wildfire monitoring setup combines outdoor app data with indoor sensor data:
- Check PurpleAir or AirNow for outdoor AQI
- Check your indoor monitor for actual PM2.5 inside your home
- If indoor PM2.5 is above 12 µg/m³, your purifier needs to run faster or your room has leaks to seal
- If indoor PM2.5 stays below 12 µg/m³ while outdoor AQI is elevated, your setup is working
Our wildfire smoke air purifier prep guide walks through sealing your clean room and sizing your purifier for smoke events. If you need a purifier recommendation, see our best air purifiers for wildfire smoke roundup.
How to Set Up AQI Alerts
Smoke can arrive overnight while you sleep. Setting up automated alerts means you wake up knowing the situation instead of finding out after you have already gone for a morning run in unhealthy air.
AirNow EnviroFlash
Go to enviroflash.airnow.gov and sign up with your zip code and email. You will receive daily AQI forecasts and alerts when air quality deteriorates. It is free and takes 30 seconds.
IQAir AirVisual
Open the app, tap the bell icon on your location page, and set custom AQI thresholds. We recommend setting alerts at AQI 100 (start running your purifier and close windows) and AQI 150 (move to your sealed clean room with the purifier on high).
Apple Weather
On iOS 16 and later, air quality notifications are enabled by default in the Weather app. If they are turned off, go to Weather settings and enable severe weather notifications, which include air quality alerts.
Google Weather
Android users receive air quality alerts through Google's built-in weather service when AQI reaches unhealthy levels. Check your Google app notification settings to confirm these are enabled.
Combining Alerts With Action Plans
Alerts are only useful if you know what to do when they trigger. Here is a quick reference:
- AQI 50-100: Close windows, start your purifier on low or auto
- AQI 100-150: Run the purifier on medium. Sensitive groups should stay indoors.
- AQI 150-200: Move to your clean room. Purifier on high. Seal the door gap.
- AQI 200+: Stay in your clean room. Purifier on max. Minimize door openings.
For detailed guidance on each threshold, our understanding AQI explainer breaks down what each range means for your health and what actions to take.
The Bottom Line
You do not need every app on this list. The minimum effective setup for wildfire season is two tools:
- AirNow for official forecasts and calibrated baseline data
- PurpleAir Map (with the EPA correction factor) for real-time, hyperlocal readings
Add IQAir AirVisual if you want push notifications with 5-day forecasts. Use your phone's built-in weather AQI as a passive first alert.
Once outdoor AQI stays above 100 for more than a day, apps alone are not enough. An indoor PM2.5 monitor confirms whether your purifier and room sealing are actually protecting you. Without that feedback loop, you are relying on hope instead of data.
Set up your alerts now, before fire season peaks. When the smoke arrives, you will already know the plan.
Last updated: July 2026. We test and compare air quality apps each wildfire season and update this guide with new features and coverage changes.
Frequently Asked Questions
What is the most accurate air quality app for wildfire smoke?
Is the AQI in my phone's weather app reliable during wildfires?
Why does PurpleAir show a different AQI than AirNow for the same location?
Do I need an indoor air quality monitor during wildfire season?
Which air quality app works best in rural areas?
Can air quality apps send push notifications when AQI gets dangerous?
How far in advance can air quality apps forecast wildfire smoke?
You Might Also Like

IQAir HealthPro Plus Review: Is It Worth $1,199?
IQAir HealthPro Plus XE review: does the $1,199 Swiss HyperHEPA purifier justify its price? We break down 0.003-micron filtration, coverage, and value.

Winix 5510 Review: The 5500-2 Successor, Tested
Our Winix 5510 review covers 252 CADR, WiFi and the Smart App, PlasmaWave, noise levels, Filter Q costs, and how it compares to the 5500-2 it replaces.

Wildfire Smoke and Pets: How to Protect Your Dogs and Cats
Learn how wildfire smoke affects pets, recognize warning signs in dogs and cats, and take practical steps to protect your animals during fire season.
DIY Box Fan Air Filter for Wildfire Smoke: Does the Corsi-Rosenthal Box Work?
Learn how to build a DIY box fan air filter for wildfire smoke using MERV-13 filters. Honest look at Corsi-Rosenthal box performance vs HEPA purifiers.